catalogue
2. Detailed explanation of algorithm
2.1 index normalization and standardization
2.2} find the maximum and minimum reference vector
2.3} calculate the correlation coefficient with the reference vector
3.3 get the maximum and minimum reference lines
3.4 grey correlation coefficient with maximum value
3.5 grey correlation coefficient with minimum value
3.6 calculation of comprehensive score
1. Introduction
TOPSIS method - matlab: Portal
Grey correlation method - matlab: Portal
2. Detailed explanation of algorithm
2.1 index normalization and standardization
There are m objects to be evaluated and N evaluation indexes, which can form the data matrix X = (xij)m*n. set the elements in the data matrix, and the elements after index forward processing are xij '
- If xj is a negative indicator (the smaller the better indicator)
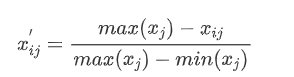
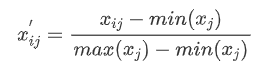
- If xj is a positive indicator (the larger the better indicator)
2.2} find the maximum and minimum reference vector
Set forward the standardized data matrix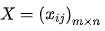 .
.
The maximum reference vector is composed of the maximum value of each index

The minimum reference vector is composed of the minimum value of each index

2.3} calculate the correlation coefficient with the reference vector
The grey correlation coefficients of the standardized data matrix X, the maximum reference vector Vmax and the minimum reference vector Vmin are obtained.
The process is modeled on Grey correlation analysis Just do it
- Selection of reference vector
For example, study the grey correlation between x2 index and x1 index. Therefore, take column x1 as the reference vector, that is, take who as the reference to study the relationship with whom. Set the reference vector as Y1=x1 and generate a new data matrix X1=x2
- Generate absolute value matrix
Let the generated absolute value matrix be A
A=[X1-Y1], also A=[x2-x1]
Let dmax be the maximum value of absolute value matrix A and dmin be the minimum value of absolute value matrix A.
-
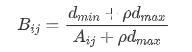
Calculate grey incidence matrix
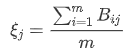
Let the grey incidence matrix be B
- Calculate grey correlation degree
2.4 scoring

3. Case analysis
Data source: LAN Zuoyun
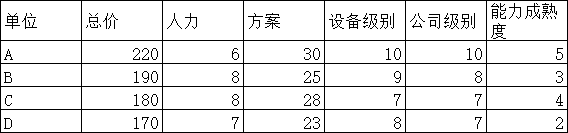
3.1 reading data
data=xlsread('D:\desktop\TOPSIS.xlsx')' %The abscissa is the evaluation index and the ordinate is the evaluation object
return:

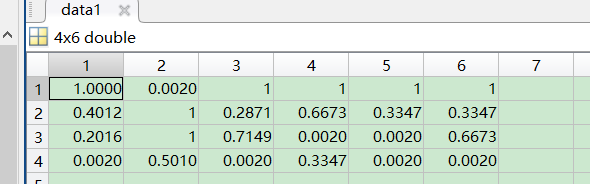
3.2 data standardization
%% Standardization
data1=mapminmax(data,0.002,1);%Normalize to 0.002-1 section
return:
3.3 get the maximum and minimum reference lines
data1=data1';
V_max=max(data1);%Maximum reference line, maximum indicator
V_min=min(data1);%Minimum reference line, minimum indicator
3.4 grey correlation coefficient with maximum value
%% Grey correlation coefficient with maximum value
[m,n]=size(data1);%Get the number of rows and columns
data2=data1;
for i=1:m
data2(i,:)=abs(data1(i,:)-V_min);
end
%The global maximum and minimum of the absolute value matrix are obtained
d_max=max(max(data2));
d_min=min(min(data2));
%Grey incidence matrix
a=0.5; %Resolution coefficient
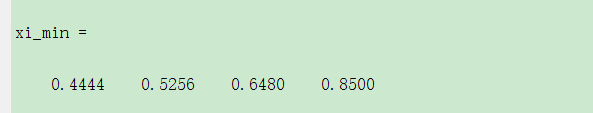
data3=(d_min+a*d_max)./(data2+a*d_max);
xi_min=mean(data3')Return:
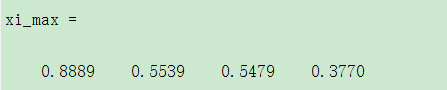
3.5 grey correlation coefficient with minimum value
%%  Grey correlation coefficient with minimum value
[m,n]=size(data1);%Number of rows and columns
data2=data1;
for i=1:m
    data2(i,:)=abs(data1(i,:)-V_max);
end
% data2=abs(data1-V_max);
%The global maximum and minimum of the absolute value matrix are obtained
d_max=max(max(data2));
d_min=min(min(data2));
data3=(d_min+a*d_max)./(data2+a*d_max);
xi_max=mean(data3')
return:
3.6 calculation of comprehensive score
%% Comprehensive score
%The greater the correlation coefficient with the largest index line, the smaller the correlation coefficient with the smallest index line, and the greater the score
Score=1./(1+xi_min./xi_max).^2;
for i=1:length(Score)
    fprintf('The first%d The scores of bidders are:%4.2f\n',i,Score(i));
end
return:

Complete code
clc;clear;
data=xlsread('D:\desktop\TOPSIS.xlsx')'; %The abscissa is the evaluation index and the ordinate is the evaluation object
%% Standardization
data1=mapminmax(data,0.002,1);%Normalize to 0.002-1 section
data1=data1';
V_max=max(data1);%Maximum reference line, maximum indicator
V_min=min(data1);%Minimum reference line, minimum indicator
%% Grey correlation coefficient with maximum value
[m,n]=size(data1);%Get the number of rows and columns
data2=data1;
for i=1:m
    data2(i,:)=abs(data1(i,:)-V_min);
end
%The global maximum and minimum of the absolute value matrix are obtained
d_max=max(max(data2));
d_min=min(min(data2));
%Grey incidence matrix
a=0.5;   %Resolution coefficient
data3=(d_min+a*d_max)./(data2+a*d_max);
xi_min=mean(data3');
%%  Grey correlation coefficient with minimum value
[m,n]=size(data1);%Get the number of rows and columns
data2=data1;
for i=1:m
    data2(i,:)=abs(data1(i,:)-V_max);
end
% data2=abs(data1-V_max);
%The global maximum and minimum of the absolute value matrix are obtained
d_max=max(max(data2));
d_min=min(min(data2));
data3=(d_min+a*d_max)./(data2+a*d_max);
xi_max=mean(data3');
%% Comprehensive score
%The greater the correlation coefficient with the largest index line, the smaller the correlation coefficient with the smallest index line, and the greater the score
Score=1./(1+xi_min./xi_max).^2;
for i=1:length(Score)
    fprintf('The first%d The scores of bidders are:%4.2f\n',i,Score(i));
end